Abstract
Statistical Process Control (SPC) is a quality management tool that uses statistical methods to monitor and control production processes. Its primary purpose is to ensure processes operate under controlled conditions and reduce variation to improve product quality.
Core Concepts
- Process Variation:
- Common Causes: Natural variations inherent in the process, usually stable and predictable.
- Special Causes: Variations caused by specific events or circumstances, typically abnormal and requiring investigation.
- Specification Limits:
- Upper Specification Limit (USL): Maximum allowable value.
- Lower Specification Limit (LSL): Minimum allowable value.
- Control Limits:
- Upper Control Limit (UCL): Predetermined upper limit in control charts, typically mean plus 3 standard deviations.
- Lower Control Limit (LCL): Predetermined lower limit in control charts, typically mean minus 3 standard deviations.
In Statistical Process Control (SPC), Cp, Cpk, Pp, and Ppk are four key process capability indices used to evaluate manufacturing process performance.
Cp & Pp: Measure process capability without considering centering. Higher values indicate better capability.
Cpk & Ppk: Measure process performance considering both centering and variation. Higher values indicate better performance.
Generally, Cpk is larger than Ppk because:
- Cpk reflects short-term capability using controlled subgroup data
- Ppk reflects long-term performance using overall process data that includes more variation sources
Shift vs Variation
Shift: Difference between process mean and target value.
Variation: Dispersion of process outputs around the mean (measured by σ).
Cp (Process Capability Index) - Short Term
Measures whether process variation fits within specification limits:

Criteria:
- Cp > 1.33: Good capability
- Cp = 1.33: Minimum acceptable
- Cp < 1.33: Requires improvement
Cpk (Process Capability Index) - Short Term
Considers both variation and centering:
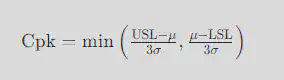
Criteria:
- Cpk > 1.33: Good performance
- Cpk = 1.33: Minimum acceptable
- Cpk < 1.33: Requires improvement
Pp (Process Performance Index) - Long Term
Similar to Cp but uses overall process data:

Criteria:
- Pp > 1.33: Good performance
- Pp = 1.33: Minimum acceptable
- Pp < 1.33: Requires improvement
Ppk (Process Performance Index) - Long Term
Considers both variation and centering for overall process:
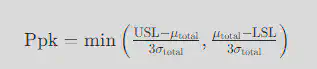
Criteria:
- Ppk > 1.33: Good performance
- Ppk = 1.33: Minimum acceptable
- Ppk < 1.33: Requires improvement
Control Charts
Common Types:
- X-Bar & R Chart:
- X-Bar: Monitors sample means
- R Chart: Monitors sample ranges
- X-Bar & S Chart:
- X-Bar: Monitors sample means
- S Chart: Monitors sample standard deviations
- I-MR Chart:
- Individual Chart: Tracks single measurements
- Moving Range Chart: Tracks differences between consecutive points
- P Chart: Monitors proportion defective
- NP Chart: Tracks number of defectives in constant sample sizes
- C Chart: Counts number of defects per unit
- U Chart: Tracks defects per unit with variable sample sizes
Six Sigma
Quality improvement methodology aiming for 3.4 defects per million opportunities (DPMO). Key metrics:
- Sigma Level: Process capability measurement
- DPMO: Defects Per Million Opportunities
Professor Liu
Mechanical Engineering Expert
An authority in the field of mechanical engineering, with research interests spanning mechanical design, automation systems, and intelligent manufacturing.